Retourner en haut

Bank of Images

Image

  • © Jan Tønnesen, Nägerl team
  • STED image of a fluorescently labeled neuron in a living brain slice, revealing its complex anatomical architecture of axons, dendrites and synapses
  • Enlarge

  • © Angela Getz & Mathieu Ducros, Choquet team IINS & BIC
  • Lattice Light Sheet image of a mouse hippocampal neuron expressing a tagged glutamate receptor (pink) concentrated at synaptic spines. Green is a GFP cell fill.
  • Enlarge

  • © Benjamin Compans, Choquet team IINS
  • Image of a cultured hippocampal neuron overlayed with the individual trajectories of glutamate receptors followed by single molecule tracking
  • Enlarge

  • © Yves Deris
  • Centre Broca Nouvelle Aquitaine, home to the Interdisciplinary Institute for Neuroscience
  • Enlarge

  • © Tomas Jorda & Gaël Barthet, Mulle team IINS
  • Human brain hippocampus slice. The hippocampus is the most vulnerable part of the brain in Alzheimer's disease (AD). Complexin 1 is marked in green. The synaptogyrin 1 is marked in red. These are two presynaptic proteins whose expression is decreased in AD.
  • Enlarge

  • © May Bakr & Jérémie Teillon - IINS & BIC
  • "The Paint Pipette" Single-cell electroporation of ~30 pyramidal neurons with the fluorescent protein mScarlet revealing the laminar organization of the entire CA1 region of the hippocampus.
  • Enlarge

  • © Rémi Galland, Quantitative Imaging of the Cell, IINS
  • Single molecule localization based super-resolution picture of the microtubule cytoskeleton within a cell spread onto a coverslip (left corner: diffraction limited image – right: depth color coded super-resolved image). Such imaging methods allow for the acquisition of image with resolution down to 10 nm radially and 40 nm axially.
  • Enlarge

  • © Tom Delaire, Corey Butler, Rémi Galland & Jean-Baptiste Sibarita - Quantitative Imaging of the Cell, IINS
  • 3D reconstruction of a cyst formed by stem cells grown within an alginate capsule by the startup TreFrog Therapeutics. The image was acquired using the light sheet microscopy technology called soSPIM, developed within the team Quantitative Imaging of the Cell. The color represents the depth of observation.
  • Enlarge

  • © Hisham Forrière, Quantitative Imaging of the Cell, IINS
  • Single molecule localization based 3D super-resolution picture of the whole nucleus of a suspended T-cell acquired using the soSPIM imaging technique developed within the team Quantitative Imaging of the Cell. The color codes for the depth of individual molecules.
  • Enlarge

  • © Scilight/U.V. Nägerl Team
  • SUSHI image of a hippocampal brain slice with a labeled neuron, which was artistically rendered.
  • Enlarge

  • © Silvia Sposini, Perrais team IINS & BIC
  • Maximum intensity projection of a fluorescently labelled mouse neuron in culture imaged by confocal microscopy, depicting the expression of neuromodulator receptors. This image also describes the concept of arborization, such as the ability of neurons to branch out in a tree-like manner, with synaptic spines resembling leaves and dendrites looking like branches.
  • Enlarge

  • © Andrea Toledo (Teams Choquet and Thoumine)
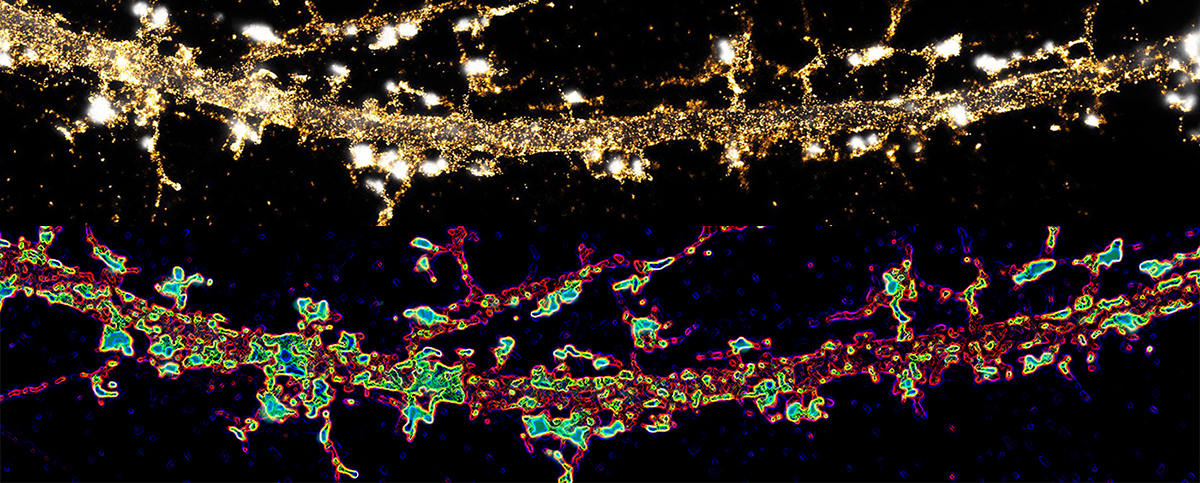
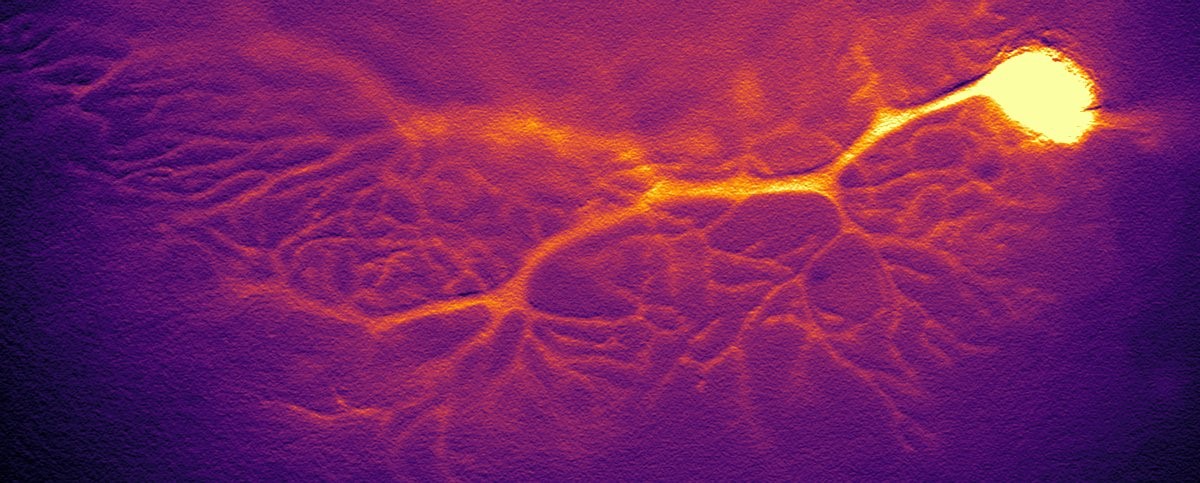
  • Hippocampal neuronal in culture expressing Nlg1 (gold) and a postsynaptic marker (white)- dSTORM microscopy (top). The same image was treated with glare edges filter (bottom).
  • Enlarge

  • © Piette Nathalie - Organ-izing the cells
  • DIV14 Rat Primary Hippocampal Neurons on micropatterned dots of adhesion proteins
  • Enlarge

  • © Julie Angibaud and Anne Beghin - Sibarita, Nagerl teams & BIC
  • Confocal image of neurospheres from rat hippocampal cells immunostained for neuronal dendrites (MAP2, green), astrocytes (GFAP, red), cell membranes (Lamin, white) and nuclei (DAPI, blue).
  • Enlarge

  • © Joana Ferreira, Groc team
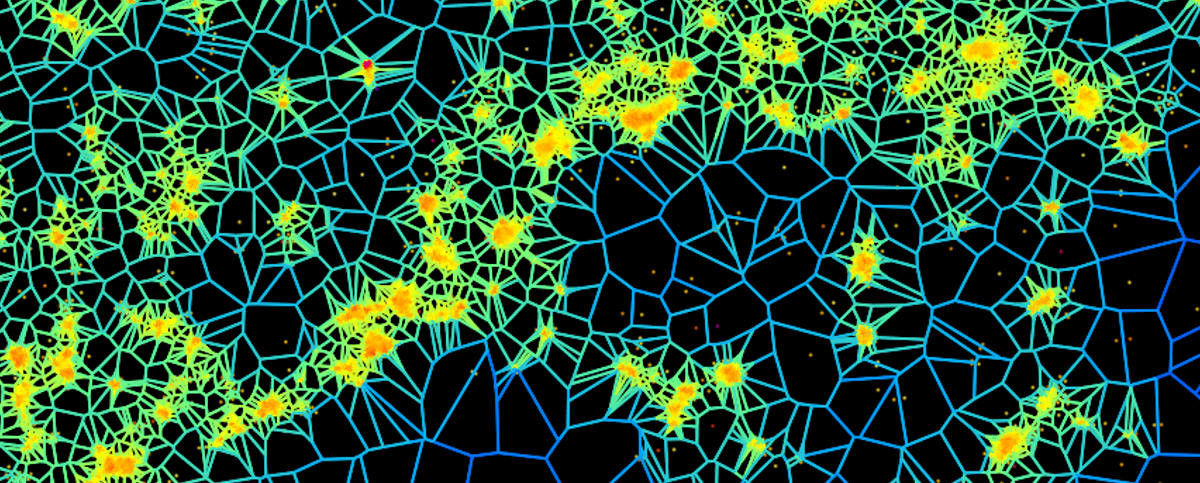
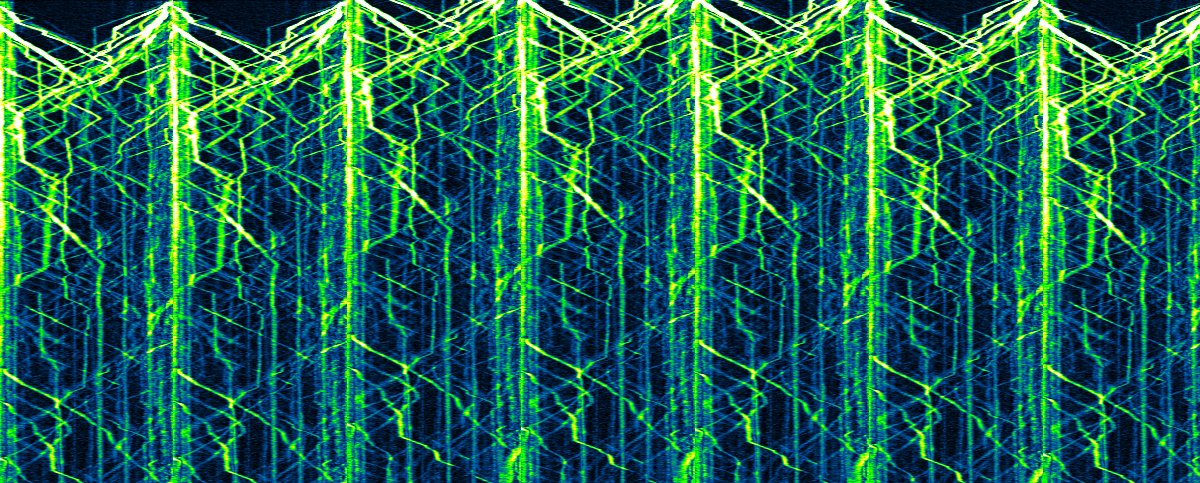
  • Pictured is a reconstructed image of single-molecule super-resolution microscopy (dSTORM) of the subunit GluN2B of NMDA receptors, using the SR-Tesseler software.
  • Enlarge

  • © Sarah Rahmati, Organ-izing the Cells and BIC
  • Confocal images of Cortical Spheroids in hydrogel-based microwells immunolabled with Nestin and Lamin
  • Enlarge

  • © M. Lagardère & O. Thoumine. Image generated using FluoSim, a software that allows for the simulation of single molecule dynamics in arbitrary 2D geometries such as this dendritic segment.
  • This image shows the simulated trajectories of membrane receptors which alternate between periods of fast free diffusion in the dentritic shaft (red tracks) and confined motion at post-synaptic densities (blue tracks). FluoSim calculates in real time the positions of hundreds of individual molecules populating the neuronal geometry and provides offline display.
  • Enlarge

  • © Ines Gonzalez-Calvo, Choquet team.
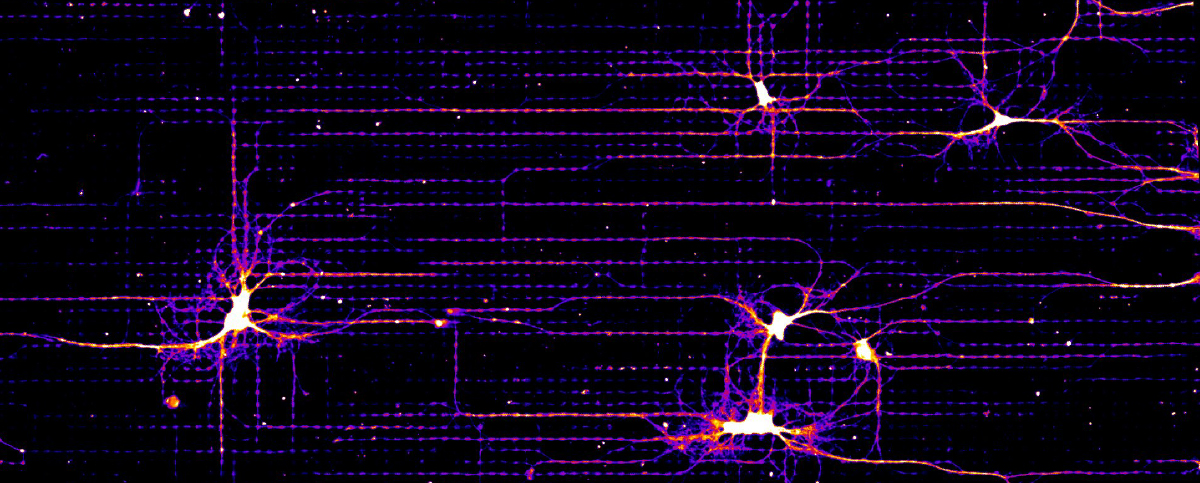
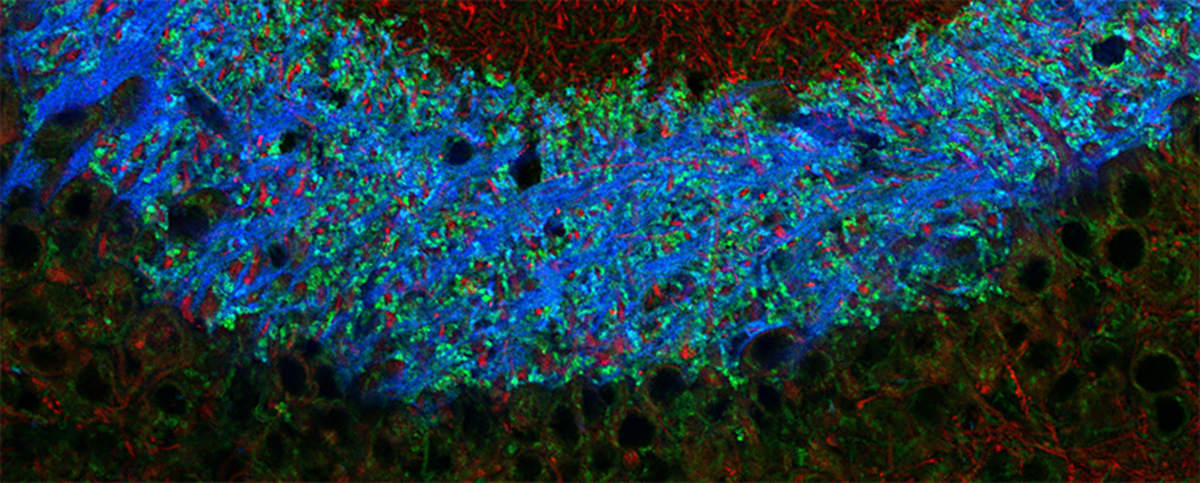
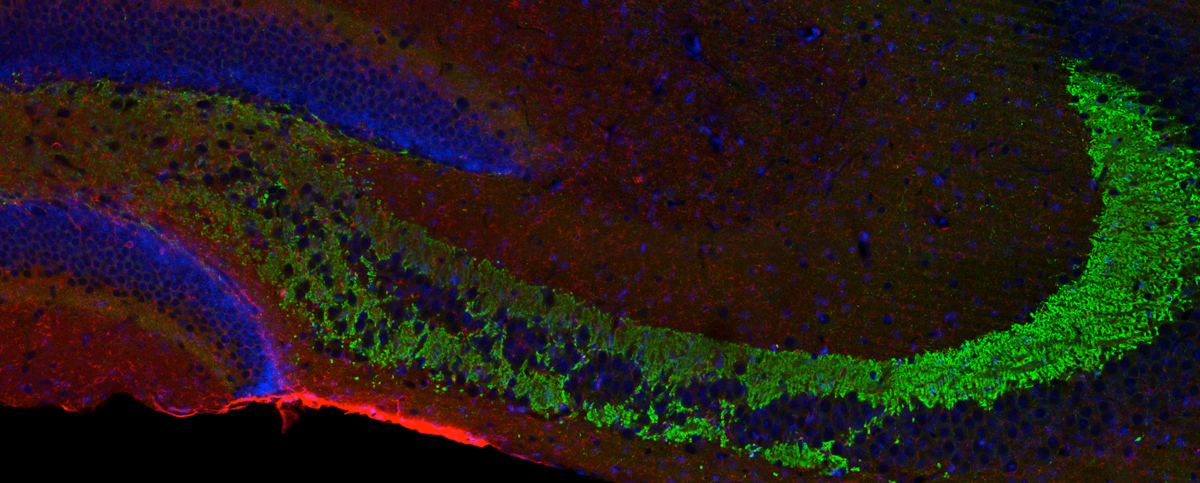
  • Purkinje neurons are the main neurons of the cerebellar cortex. They have a very complex and characteristic morphology, their intricate dendrite tree, that is flat, can be observed during whole-cell patch clamp recordings if we add to the internal solution a fluorescent molecule, such as Lucifer Yellow.
  • Enlarge

  • © Gaël Barthet, Team Mulle
  • Mossy fibers (axons of granular cells of the hippocampus) marked for Syt7 (blue), Vamp2 (green) and Map2 (red).
  • Enlarge

  • © Marie-Lise Jobin, Choquet team & BIC
  • Super-resolution (STED) image of cultured hippocampal neurons filled with a fluorescent marker and showing the diversity of spine shape along dendritic shafts.
  • Enlarge

  • © Diogo Neto, Choquet and Perrais teams & BIC
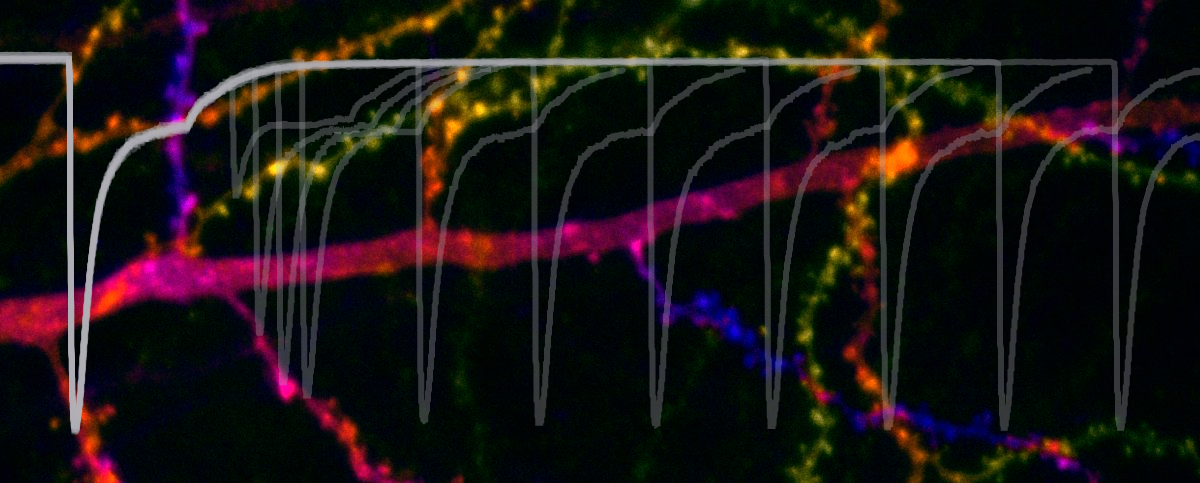
  • Two sides of the same coin. The same protein visualized by electrophysiology and fluorescence microscopy in cell lines and hippocampal neurons, respectively
  • Enlarge

  • © Vincent Paget-Blanc, Julie Angibaud, and Guillaume Dabee. Perrais Team, BIC and PIV-EXPE
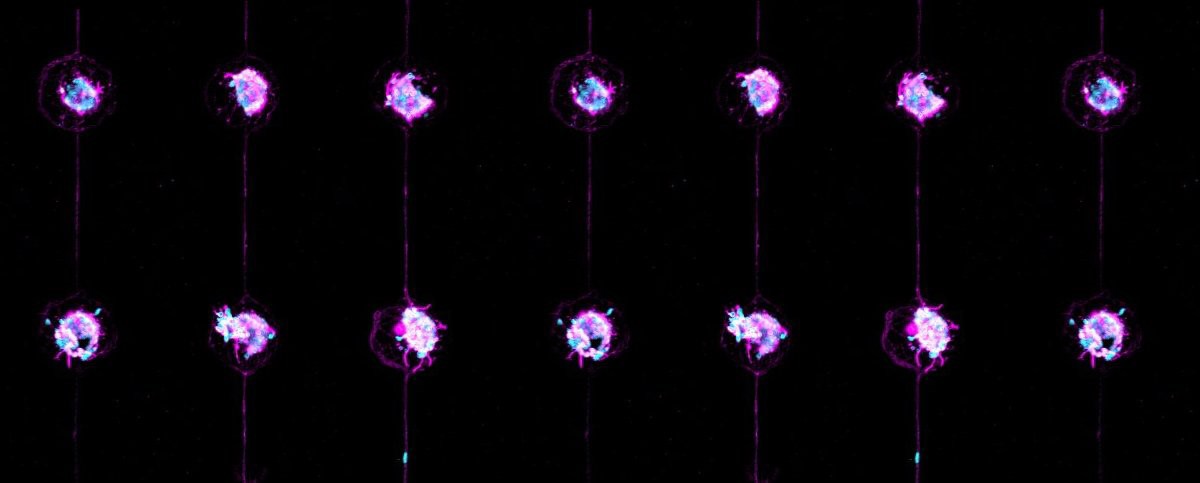
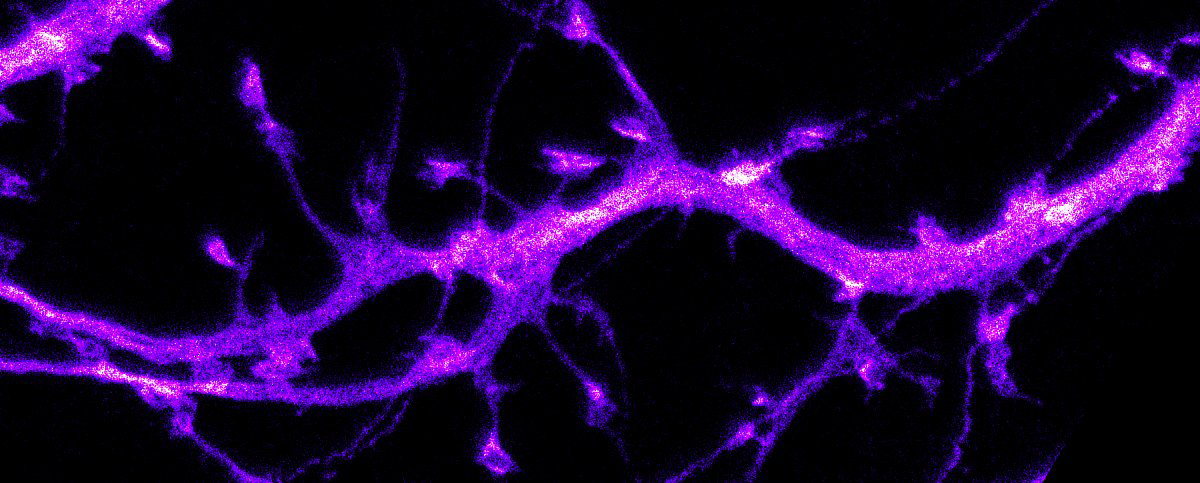
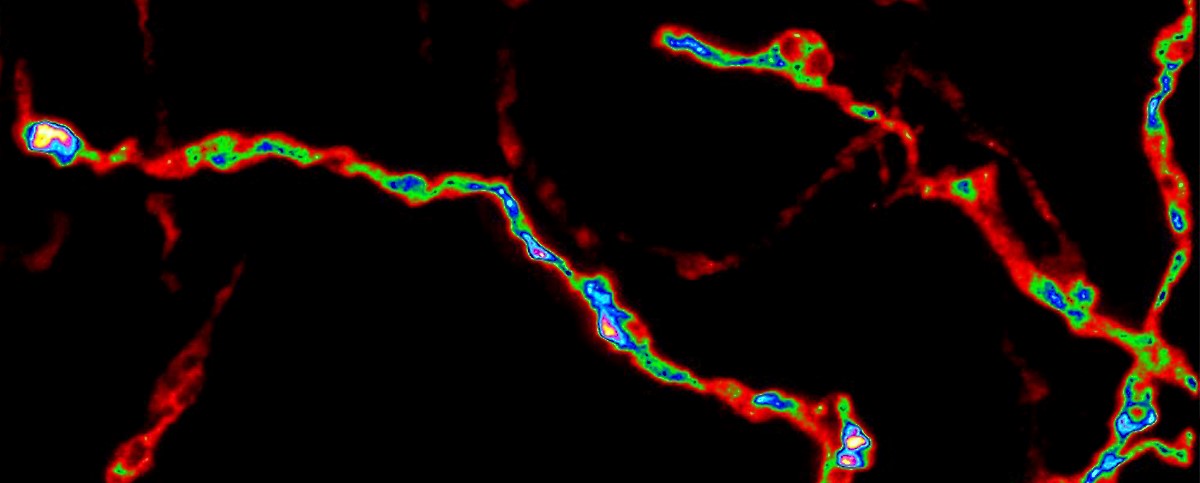
  • This image represents VTA Dopamine axonal projections to the striatum acquired using STED microscopy. In this picture, we can distinguish multiple prototypical dopaminergic varicosities formed in the axonal fibers. The pseudocolor Look-Up Table "mpl-viridis" outlines the variation of signal intensity.
  • Enlarge

  • © Marlene pfeffer & Etienne Herzog, Perrais team, IINS
  • GFP-labeled (green) brain synapses were purified in a cell sorter, collected on glass coverslips, immunostained (magenta) and pictured at the laser scanning microscope. Semi-automated analysis extracts and organise synapses into matrices.
  • Enlarge

  • © Marine Cabillic, Quantitative Imaging of the Cell, IINS
  • HCS-dSTORM on p96 of PD-1 membrane receptors of Jurkat cells, a promising target for immunotherapies. Images performed using the HCS-SMLM Imaging platform which combined localization-based super-resolution microscopy with High Content Screening approach, developed in the team Quantitative Imaging of the Cell.
  • Enlarge

  • © Agata Idziak, Nägerl team, IINS
  • Super Resolution Shadow Imaging (SUSHI) of a dentate gyrus area in a mouse hippocampal organotypic slice. By labeling the extracellular space, all cells appear as “negative” imprints, revealing an unbiased nano-anatomy of the tissue.
  • Enlarge

  • © Elisabeth Normand, PIV, et Yann Humeau, Humeau team, IINS
  • 2-Photon image of the mouse hippocampe CA1 region. GABAergic interneurons are labelled in green, glutamatergic pyramidal cells in red. The interplay between these classes of cells is crucial for neuronal networks physiology and brain computation.
  • Enlarge

  • © Côme Camus, Choquet Team
  • Confocal image of a hippocampal neuron in culture immunolabelled against PSD-95 (original image on the left side and inverted look-up table image on the right side).
  • Enlarge

  • © Misa Arizono, Nägerl team
  • The brain kit - This image represents components of the brain acquired by super-resolution microscopy and designed to look like the parts of a plastic toy. It reflects the spirit of bottom-up research where we study the different parts and try to put them together to understand the brain.
  • Enlarge

  • © Caroline Bonnet, Choquet team, BIC
  • Kymograph obtained from transport of neosynthetized Td-Tomato-GluA1 containing vesicles in cultured hippocampal neurons.
  • Enlarge

  • © Jimmy George and Thierry Amédée, Team Mulle
  • P2X4 receptors (green) are highly expressed in hippocampal mossy fibers in wild type mouse. DAPI staining (blue) highlights dentate gyrus
  • Enlarge